How to use jconsole to monitor and manage WSO2 WSAS
Service or system monitoring and management are essential components of any SOA framework. WSO2 WSAS provides two different mechanisms to manage and monitor web services.
1. Ajax based GUI console
2. JMX based monitoring facility
In this post, I'm going to demonstrate the second option, JMX based service and system monitoring component. You can find more information about WSAS GUI console from here.
JMX (Java Management Extension) provides a set of tools and APIs for applying a standard client/server-based architecture to monitoring and management of a Java application.
J2SE version 5.0 adds core support for the Java Management Extensions (JMX) into the Java standard libraries. We are going to use Jconsole, included in jdk1.5 or newer versions, to explore the management and monitoring capabilities provided by WSO2 WSAS.
Pre-Requisites
Download and install WSO2 WSAS-2.2.1 or later
Step 1
JMX port is disabled by default in WSAS. Open WSO2WSAS_HOME/conf/server.xml and uncomment the following element.
<!--The JMX Port-->
<JMX>9999</JMX>
Step 2
Start WSO2 WSAS (run wso2wsas.bat or sh).
Make a note of the JMX url which will be printed on server startup console
i.e:- JMX Service URL : service:jmx:rmi:///jndi/rmi://YourHost:9999/server
Step 3
Start command prompt (or shell in linux), type Jconsole and hit enter. JConsole:Connect to Agent window will be popped up.
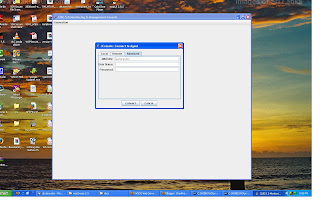
Enter JMX url (service:jmx:rmi:///jndi/rmi://YourHost:9999/server)
Enter admin as user name and password. Note that, any user with admin privileges can log in to JMX.
Click on Connect.
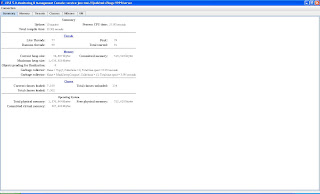
You will be directed to the summary page of Jconsole as follows.
Step 4
Click on MBeans tab. You will see the Mbeans tree in the left pane. Select org.wso2.wsas MBean.
ServerAdmin, ServiceAdmin and StatisticsService MBeans will be listed there.
Select ServerAdmin.
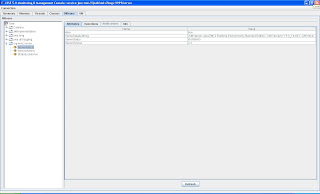
You will see shutdown, restart, restartGracefully, shutdownGracefully, startMaintenance and endMaintenance administrative functions when clicking on Operations tab in the above screen.
Step 5
We observed a few administrative function of WSo2 WSAS which were exposed through JMX in the above step. Lets see how service statistics are monitored using Jconsole.
Click on StatisticsService Mbean at the left pane. Next, select Operations tab.
Following screen will be displayed.
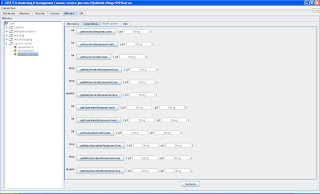
In order to check service statistics, we must invoke a service deployed on WSAS. Open your browser and enter the following URL.
http://localhost:9762/services/version/getVersion
This will send a HTTP GET request to the default Version service.
Now enter 'version' as the value of the getServiceRequestCount operation in above screen and click on getServiceRequestCount.
You will get '1' as the response.
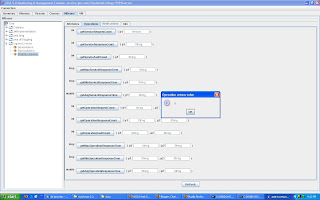
Invoke Version service a few more times (just send http GET requests using the above URL).
Enter 'version' as parameter 1 (p1) and 'getVersion' as parameter 2 (p2) of getOperationRequestCount operation.
You will see a operation return value similar to the one bwlow.
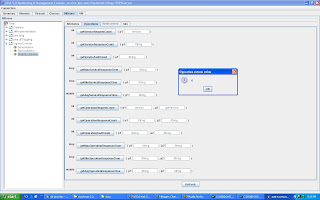
Now, you will be able to proceed with more operations and get the statistics of server and system status.
1. Ajax based GUI console
2. JMX based monitoring facility
In this post, I'm going to demonstrate the second option, JMX based service and system monitoring component. You can find more information about WSAS GUI console from here.
JMX (Java Management Extension) provides a set of tools and APIs for applying a standard client/server-based architecture to monitoring and management of a Java application.
J2SE version 5.0 adds core support for the Java Management Extensions (JMX) into the Java standard libraries. We are going to use Jconsole, included in jdk1.5 or newer versions, to explore the management and monitoring capabilities provided by WSO2 WSAS.
Pre-Requisites
Download and install WSO2 WSAS-2.2.1 or later
Step 1
JMX port is disabled by default in WSAS. Open WSO2WSAS_HOME/conf/server.xml and uncomment the following element.
<!--The JMX Port-->
<JMX>9999</JMX>
Step 2
Start WSO2 WSAS (run wso2wsas.bat or sh).
Make a note of the JMX url which will be printed on server startup console
i.e:- JMX Service URL : service:jmx:rmi:///jndi/rmi://YourHost:9999/server
Step 3
Start command prompt (or shell in linux), type Jconsole and hit enter. JConsole:Connect to Agent window will be popped up.

Enter JMX url (service:jmx:rmi:///jndi/rmi://YourHost:9999/server)
Enter admin as user name and password. Note that, any user with admin privileges can log in to JMX.
Click on Connect.
You will be directed to the summary page of Jconsole as follows.

Step 4
Click on MBeans tab. You will see the Mbeans tree in the left pane. Select org.wso2.wsas MBean.
ServerAdmin, ServiceAdmin and StatisticsService MBeans will be listed there.
Select ServerAdmin.

You will see shutdown, restart, restartGracefully, shutdownGracefully, startMaintenance and endMaintenance administrative functions when clicking on Operations tab in the above screen.
Step 5
We observed a few administrative function of WSo2 WSAS which were exposed through JMX in the above step. Lets see how service statistics are monitored using Jconsole.
Click on StatisticsService Mbean at the left pane. Next, select Operations tab.
Following screen will be displayed.

In order to check service statistics, we must invoke a service deployed on WSAS. Open your browser and enter the following URL.
http://localhost:9762/services/version/getVersion
This will send a HTTP GET request to the default Version service.
Now enter 'version' as the value of the getServiceRequestCount operation in above screen and click on getServiceRequestCount.
You will get '1' as the response.

Invoke Version service a few more times (just send http GET requests using the above URL).
Enter 'version' as parameter 1 (p1) and 'getVersion' as parameter 2 (p2) of getOperationRequestCount operation.
You will see a operation return value similar to the one bwlow.

Now, you will be able to proceed with more operations and get the statistics of server and system status.

Comments
http://cheappolos.blog.drecom.jp
http://d.hatena.ne.jp/crystal666
http://www2.atword.jp/pumaspeed
http://www.seriousblogging.com/basketspuma
http://wholesalepoloshirts.edublogs.org
http://www.teenblog.org/Kingluo
http://blog.goo.ne.jp/pumafr
http://poloshirts.spaces.live.com